For our first venture into the wide world of zoo and aquarium data, let’s take a look at something fairly high level that will apply to a lot of people. In this case, we’ll be looking at market penetration.
Market penetration can be defined as how many people are using your product (in this case a zoo or aquarium) within a particular market. We calculate this metric by dividing your total attendance number by the total size of your market. In other words: what is the percentage of likely visitors to your zoo ware actually visiting?
As it turns out, market penetration is a pretty good key performance indicator (KPI) metric. For good reason–so much of a zoo’s overall health is tied to attendance. But if we were to compare all AZA zoos on market penetration with no context, we’d be missing a huge part of the story.
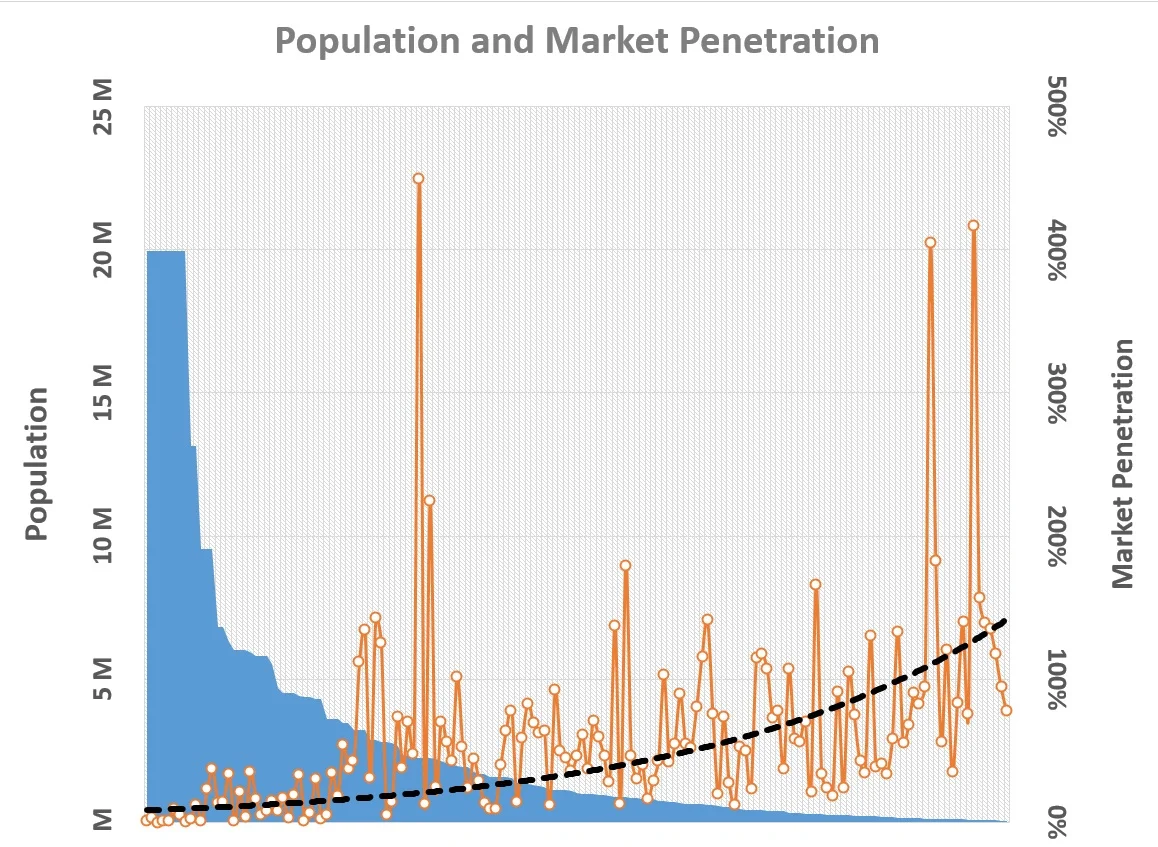
In this case, the context is market size. Take a look at this chart:
Is it better to be the tail of the lion or the head of the rat?
The blue area indicates the Combined Statistical Area (CBSA) population size as of the 2010 census of each of the 159 United States zoos who reported attendance data to AZA for the 2013 member directory. As we move from left to right, we’re looking at zoos in progressively smaller markets. Each white dot along the jagged orange line represents the market penetration of a single zoo. Notice anything? As indicated by the dotted black trend line, there is a clear inverse correlation between market size and market penetration. In other words, as markets get bigger, market penetration gets smaller.
Seems obvious, right? Big markets have more competition–a lot more! Zoos in small markets will always be a big draw. Also, the size of a large city’s zoo doesn’t scale up in proportion to that of a small city’s. If anything, the inverse is true because space is at such a premium in big cities. So what, why do we care about this?
Because CONTEXT. Like I mentioned earlier, context is king. Data in a vacuum is useless at best, and can be hugely misinforming at worst. What if I told you that Zoo X had a 9% market penetration in 2012? Oh no, they must be in trouble! But wait, Zoo X is Bronx Zoo, and that 9% represents over 1.8 million visitors. 9% looks a little better now!
That’s why I think this example is the perfect one to kick off our series on data analysis in the zoo and aquarium world. It illustrates the importance of seeing the whole picture.
“So, what should my market penetration be?”
This is one of the most frequent questions we get here at Zoo Advisors, and it’s very tricky to answer definitively. There are A LOT of variables in play. However, based on our current analysis of the available data, the most important factor is market size. Across United States AZA organizations who reported attendance data for the 2013 member directory, median market penetration by market size looks like this:
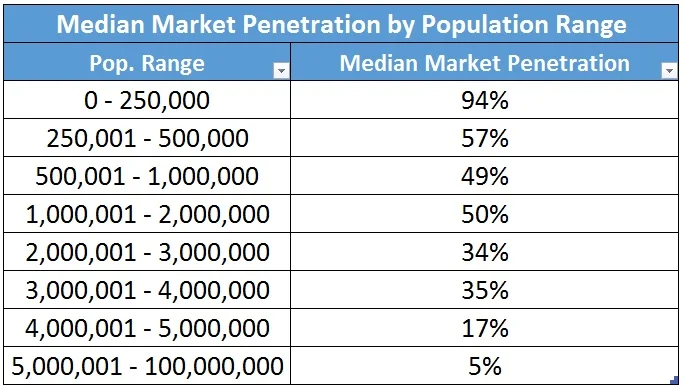
Again, this chart is not the definitive answer to what your market penetration should be, just a snapshot of what the data looked like last year in our industry. There are some major outliers. If you’re curious, I’d be glad to have a closer look your zoo or aquarium’s data (with 90% more context!) — shoot me an email at zwinfield@canopysp.com.