We’re in a growing industry, but not everyone is growing at the same rate. Who’s growing the fastest? How do you compare? Zoo Advisors has analyzed the data over the past decade to give you the answers.
If you were to pick just one number on which to judge the health of your institution, it would probably be attendance. Every guest through your gate means admissions revenue, gifts and concessions, potential members and donors, and most importantly, an opportunity to share your conservation mission.
How have attendance levels at zoos and aquariums changed over the past seven years?
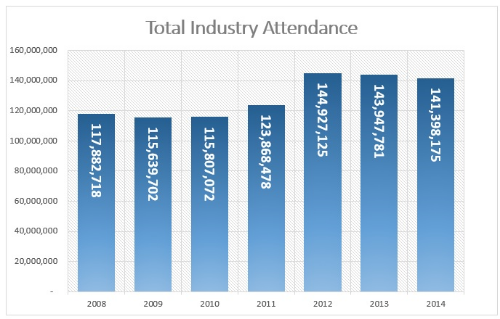
Over the last seven years, total reported attendance from AZA institutions rose from about 118 million to over 141 million. Looking good! But this number doesn’t capture the whole story in that more institutions are now reporting data than were in 2008 (207 now compared to 188 in 2008), so it’s more appropriate to look at attendance on an per-organization, average basis:
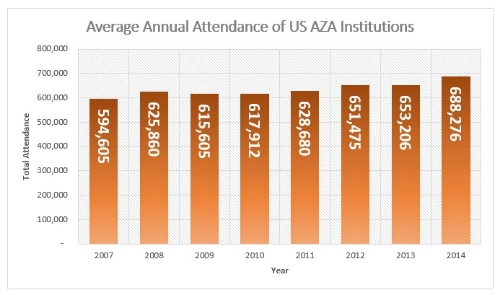
What we see here is that the average zoo or aquarium has seen a total increase of over 90,000 visitors since 2007. Again, an impressive increase. This can at least partially be attributed to growing populations—of 398 total MSAs in the United States, 314 of them are experiencing positive population growth.
With that in mind, another way to look at growth is in terms of market penetration—your organization’s total attendance divided by the population of your metropolitan statistical area:
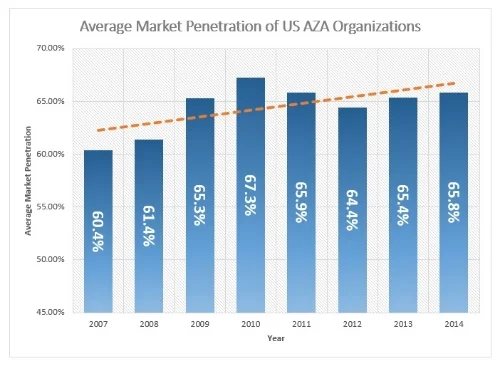
Here, we see that market penetration of AZA organizations has increased by a hair over 5%. Therefore, attendance is growing at a faster rate than overall population growth. The takeaway here is that most areas in the nation are experiencing positive population growth, but zoo attendance is growing at a more rapid rate. High-fives, everyone!
Let’s zoom in. One way we often go about grouping organizations is by looking at them in relation to zoos with similar attendance figures. As it turns out, not all zoos and aquariums are growing at the same rate:
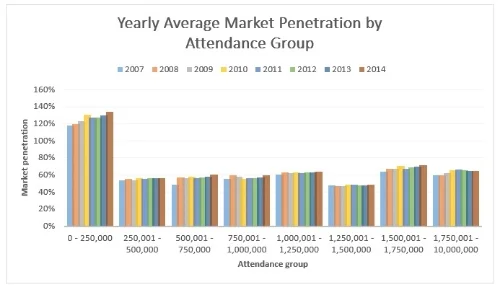
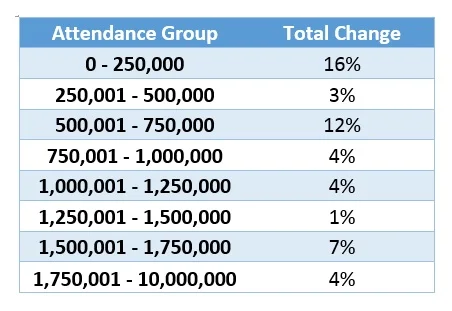
What we see here is that while organizations of all sizes are experiencing growth, those towards the smaller end of the spectrum are achieving larger gains in market penetration. The 2007-2014 total change in penetration by attendance group is as follows:
So, how does your institution stack up? If you’re lagging behind and interested in finding out why, drop us a line here and we’ll get in touch. If you’re ahead of the curve, congrats! But let us help you read the data to see if you can keep ahead of that trend. Thanks for reading!