Five years ago, Zoo Advisors published a whitepaper exploring the relationship between admission and membership programs, and more specifically, how the pricing of those programs are correlated in the zoological industry. In short, the paper sought to dispel a pervasive myth about that relationship: that there was a single, magical “price ratio” that would appropriately balance these two critical programs, and that by sticking to that ratio, any organization could feel confident that their membership pricing was “appropriate.”
The key takeaway from this analysis was that there was in fact not a single ratio for success, and that in aggregate, successful membership price ratios (MPRs) were inversely correlated to admissions pricing: that is, as admissions price goes up, MPR declines.
As we approach the five-year anniversary of that whitepaper, we thought this was a good time to revisit the question, reevaluate all the new data that we’ve collected since then, and determine what (if anything) has changed. After all, among the dozens of pricing strategies that zoological executives are faced with, there is none more important than this one. These two facts remain:
-
Access to your facility is your most valuable asset.
-
Admissions and membership programs typically account for more than 90% of how constituents access that asset.
Therefore, the choice about how to price that asset is the single most impactful decision you can make.
So, what has changed in the past five years? Have zoos and aquariums altered the way they price their memberships in relationship to admissions programs? The answer is yes, they have, but interestingly, they haven’t changed in one direction or the other. Before we share our findings, a few notes about our process and terminology:
What is a membership price ratio? Membership price ratio, or “MPR,” is a metric that seeks to correlate membership pricing to admissions pricing. As organizations price their admissions at lots of different levels, we can’t evaluate membership on an absolute basis, it has to be analyzed in relationship to admissions. Therefore, MPR is expressed as a numerical value derived by dividing the cost of a family membership by the sum cost of two adult and two child admissions.
Which organizations did we evaluate? Our sample group included 110 United States-based zoos for which we were able to gather relevant data in each year between 2015 and 2019. We excluded international organizations in order to avoid currency conversions, as well as organizations with non-traditional pricing structures such as dynamic pricing, or a-la-carte membership programs. For organizations with variable pricing (e.g. separate summer and winter pricing), we took “high season” pricing as our data points.
How did we evaluate the data? We calculated the actual MPR for each organization during each of the five years we evaluated, and then developed an “expected MPR” using an exponential trend equation, with the average admissions fee (average of one adult and one child) as our X-value.
As an example, the scatter plot for one of the years appears below:
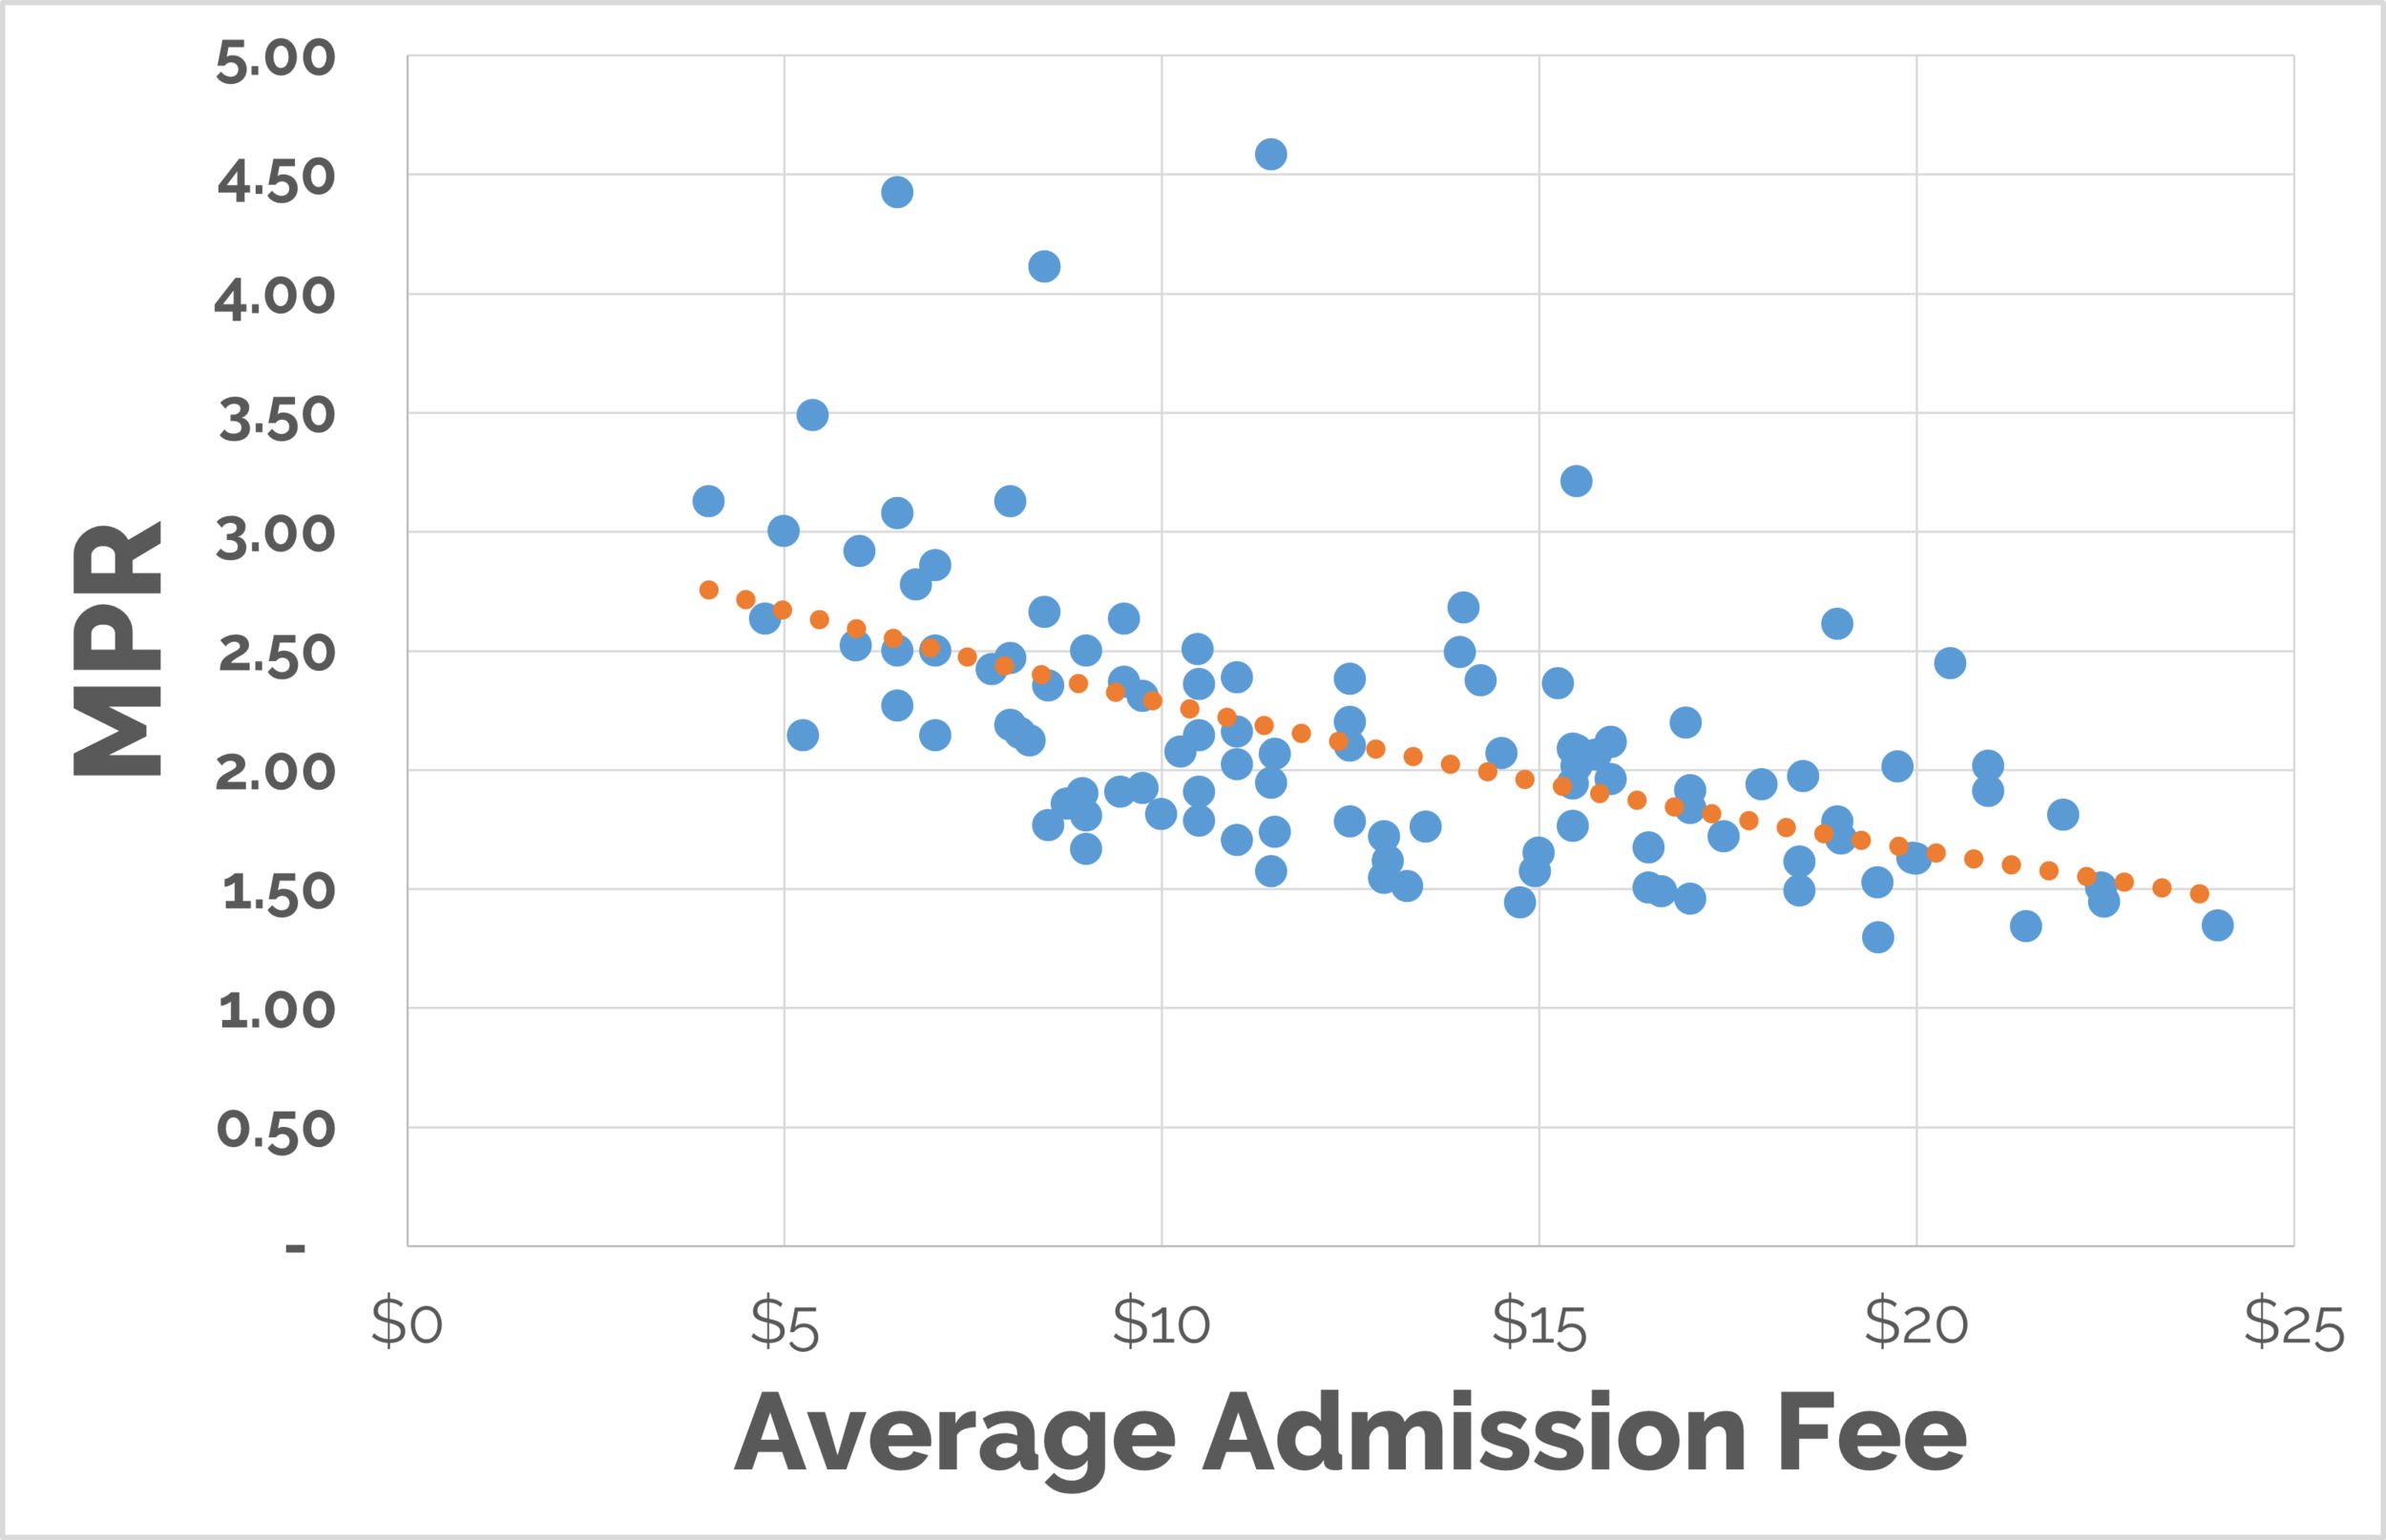
That’s a fairly good fit for real-world data, and we observe (as we did five years ago) that the trend of inversely correlated MPR and admissions fees remains true today. Organizations with lower admissions fees tend to have higher MPRs, and vice versa.
Now onto what has changed. In the chart below, the blue line shows the expected (i.e. trend) value for MPR in 2015, while the orange line shows the same calculation in 2019.
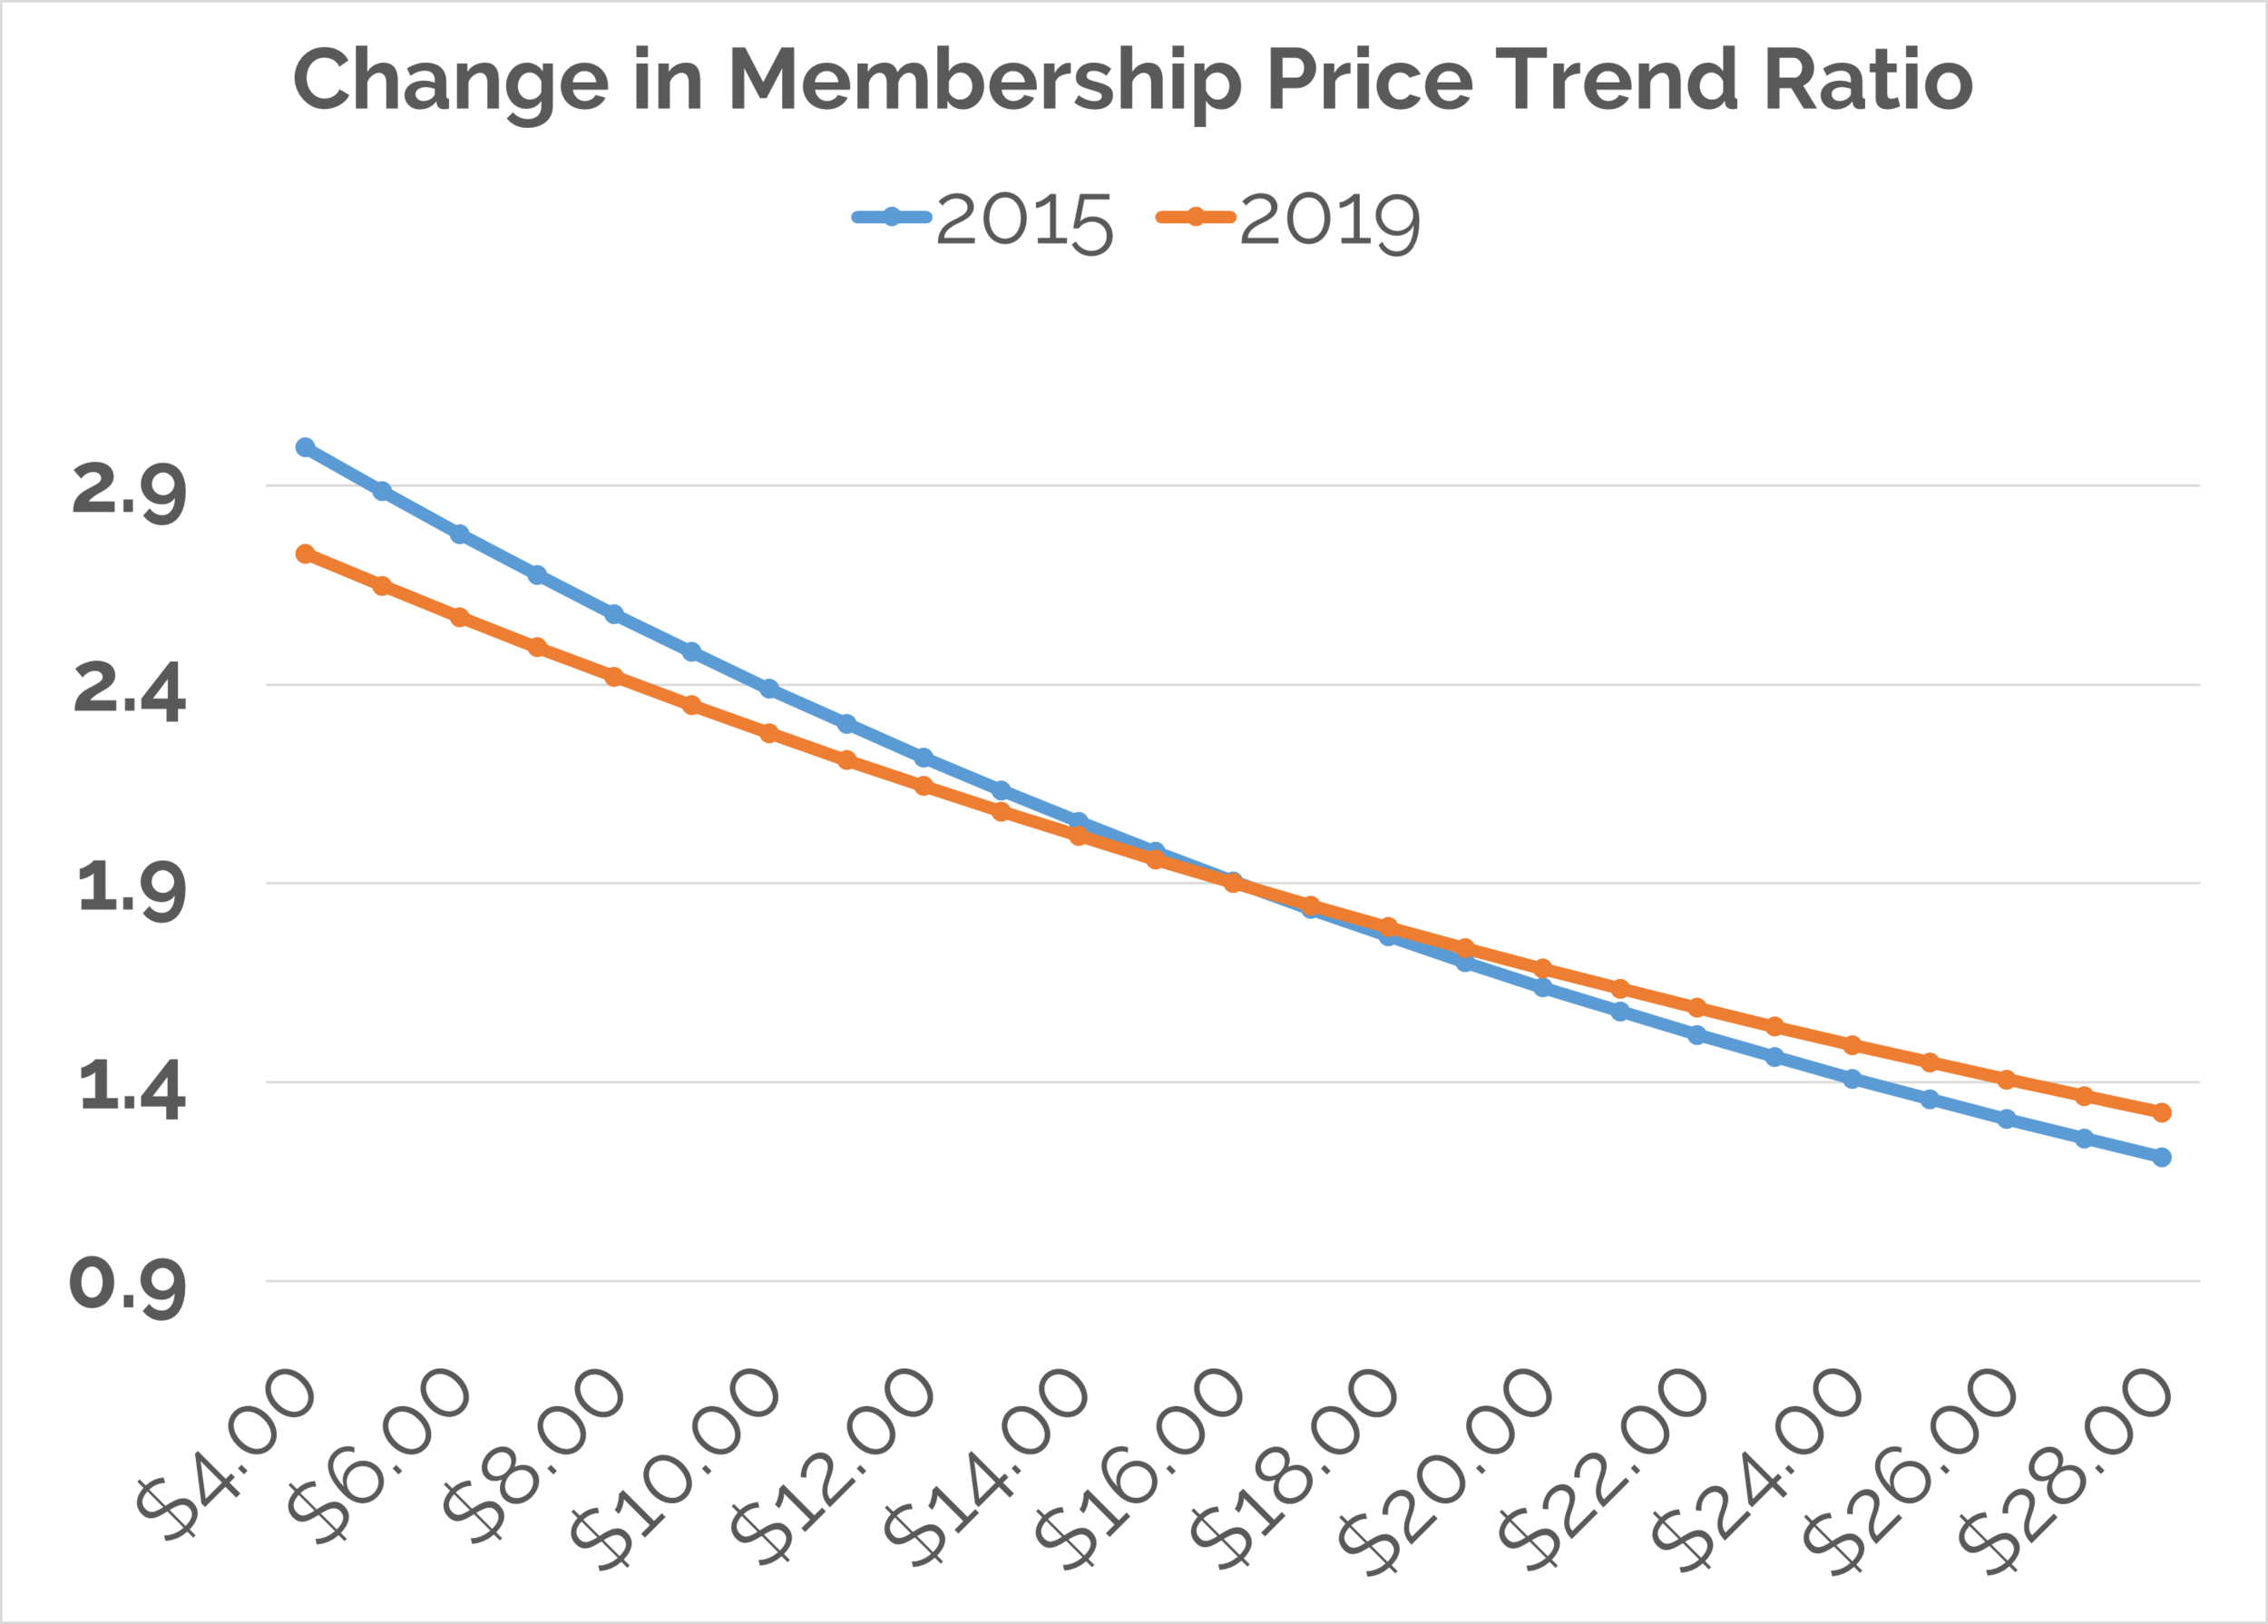
Here’s what we see:
Organizations on the lower end of the price spectrum (i.e. those with average admissions fees below $16) have a lower expected MPR in 2019 than they did in 2015. Based on the industry data, these organizations have lowered the cost of their memberships in relationship to their admissions pricing. 80 organizations fall into this price range.
Organizations on the higher end of the price spectrum (i.e. average admissions fees above $16) have increased their MPR since 2015. The remaining 30 organizations from our analysis fall into this price range.
This is interesting, and it also deserves more thought into why these changes have occurred:
-
A decrease in MPR does not mean that the absolute price of a membership has decreased. To the contrary, most organizations in our dataset increased their prices during the five years we evaluated. It was their MPR that decreased. Since we published the original whitepaper in 2015, we have spoken at great length in print, to our clients, and in conferences about those initial findings, and it appears as though our advice has been heeded: as admissions prices increase, MPR should (and does) decrease.
-
But by taking that practice to its logical conclusion, price ratios would eventually fall below 1.0, meaning that it would hypothetically be less expensive to buy a membership than admissions for family of four, which is obviously a ridiculous and economically untenable proposition. The data above tells us that organizations on the more expensive end of the spectrum have recognized this fact, too. Membership cannot become too good a deal without negatively impacting a financially healthy visitor composition.
Taking into account all of the above, we view these changes as extremely positive. Organizations with lower-end admissions prices are steadily raising those fees while simultaneously decreasing MPR in order to ensure they maintain enough members. Conversely, higher-end organizations (which are also increasing admissions fees) are increasing MPR to make sure their memberships don’t get too cheap in relationship to admissions to avoid ending up with too many members.
These are all good indicators that in aggregate, the profession is taking a thoughtful and measured approach to valuating access to sites, and building a strong and sustainable economic foundation to support the critical conservation work they support.
How should organizations act on this information?
It’s very important to keep in mind the “pre-COVID” context of this analysis. All data in the assessment was gathered during “the before,” and the world is arguably a marginally different place today than it was in 2019, at least in the short term. We must ask ourselves, from a purely economic standpoint, should the way we valuate access to our facilities change? If so, how?
Based on conversations and observations about the state of the profession over the first and second quarters of 2021, visitation to AZA organizations has rebounded strongly. While many organizations are still operating under various capacity restrictions, the capacity that is available is being easily consumed. Stated simply, demand is outpacing supply. As anyone who has taken a basic economics case knows, that creates conditions where more aggressive pricing strategies are reasonable.
While every situation is unique and we would never make a blanket recommendation to an entire industry, it is very likely that now is a good time to revisit your pricing strategies to make sure you’re getting the most out of them. Zoo Advisors would be pleased to be a resource to your organization in these areas, as we have been to dozens of your peers in recent years.
If you’d like to chat with our team about your admissions and membership programs, drop us a line today.