By: Gabe Buckley
Organizations are continually striving to gain a deeper understanding of their target audience and determine if their products or services are accessible to a wide range of individuals from different socioeconomic backgrounds, and to ensure they are not inadvertently excluding any particular community or income group.
Introducing Audience Analytics
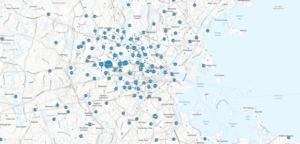
Canopy’s new Audience Analytics service leverages the power of cellphone location data to provide these valuable insights into the demographics of your visitors. This up-and-coming technology provides organizations with the ability to estimate the income and ethnicity of their visitors (in addition to many other standard demographics). With approximate home locations of visitors, organizations can quantify how many visits they are generating from different neighborhoods. We can look at visitor data over any time period (back to 2017), break it down quarterly, and compare it with other data from organizations in your city or from across the country!
Audience Analytics can tell you where your audience is coming from, approximate who they are, and help you strategize paths into new audiences, communities, or events!
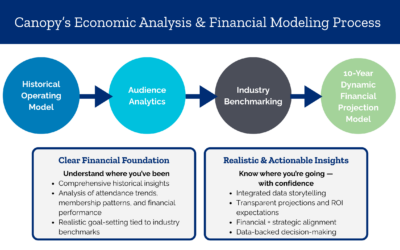
How Will Audience Analytics Help My Organization?
By tracking the effectiveness of various marketing strategies through Audience Analytics, organizations can refine their strategy and marketing efforts to better target their desired audience. With an interactive map to see your audience and help plan your strategies, this service provides organizations with the data they need to optimize their marketing efforts, quantitatively assess strategic goals, or check the effect of a new financial access program. We build a custom set of metrics to watch throughout the year, giving you quarterly updates on any changes we see. Then, we talk about what seemed to work, what didn’t, and what you might want to try next.
Client Case Studies
Our first two partners in this innovative process – ABQ BioPark and Como Park Zoo – have already started learning about their visitors. ABQ BioPark operates four different sites across Albuquerque including the Zoo, Aquarium, Botanic Garden, and a public beach. We are watching the visitors evolve at these four sites, and in four additional sites in Albuquerque that give us an opportunity to compare to other cultural attractions. In Como Park, we’re working to better understand the weekly structure of visitors by looking at how visitors change by day of the week – across quarters. By comparing quarters from 2023 to the same quarters from 2019 and 2022, we can get a sense of how site use and visitor composition has changed at different time scales and how current programs may be affecting visitors.
Canopy is excited to offer this new service to our clients, and we’re confident it’ll provide them with valuable insights aligned with their specific goals. If you’re interested in learning more about Audience Analytics and how it can benefit your organization, please contact us!