The U.S. Population is Shifting
By Gabe Buckley
If you follow demographic trends to help predict how visitors will be attending your organization over the next year or decade, a recent report by the U.S. Census Bureau (click here to access) may have you worried or elated – depending on what size city your organization is in.
The report highlights some very high-level trends in demographic data across the U.S. The main trend that has people talking is this:
- Large cities are declining by 0.4%
- Other areas are increasing by 0.4%
- This is a complete reversal of the trend seen through the 2010s!
Furthermore, the report details that populations of the largest cities (think New York, Los Angeles, and Houston) are decreasing at an average rate of 1.7%. On the other hand, many smaller cities (think Des Moines, Little Rock, and Boise) are increasing by an average of 0.3%.
Ready to jump for joy or scramble to rethink your revenue model based on your city size? Let me ask you another question: Do these large-scale population trends really affect how many visitors you’ll receive?
As I tested this hypothesis, I found three undeniable conclusions: 1) Attendance is complicated. 2) Attendance is complicated. 3) Attendance is complicated. Keep reading to see why it’s so complicated – and more importantly – what we can do about it!
Population Change vs. Visitation
First, let’s look at the absolute number of visitors who attended zoos of different sizes in 2019 and compare that to the most recent data from 2022. By analyzing mobile phone location data from zoos, we can compare “Big City Zoo” visitation data directly to “Small City Zoo” visitation data. Check it out:
Interesting. At first glance, it does appear that Big City Zoos are losing visitors at a high rate. However, this graph also shows that Small City Zoos have fewer visitors now than they did in 2019. This brings me to my first point: Attendance is complicated.
Cleary, population increases or decreases do not (by themselves) drive total visitation numbers. Something else is clearly dragging both numbers down, and luckily, we can make a pretty good guess at the culprit: the pandemic. Let’s see if we can tease out the effect the pandemic had on visitation, to better understand if these large-scale population trends are affecting zoo visits in cities of different sizes. To start, let’s look at how visitor averages during the pandemic (2020 and 2021) compared to 2019:
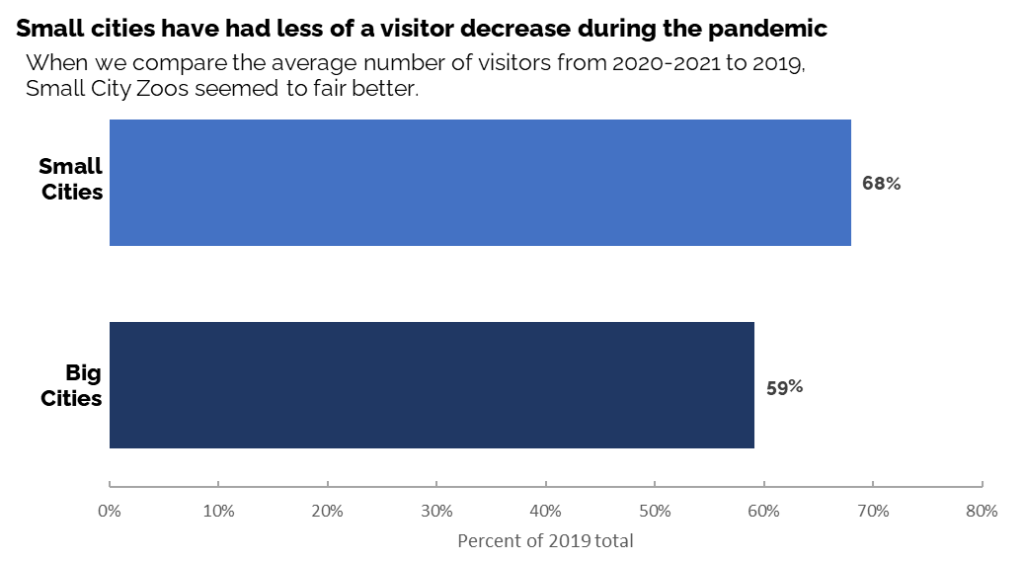
Look at the massive drop in Big City Zoo visitation during 2020. Was this caused by an exodus of people from large cities? Probably not. Remember, due to population size and density many large cities had more strict pandemic protocols than the average small city. Zoos in big cities likely saw this effect directly as their visitation plummeted. Major tourism routes were cancelled, stricter social-distancing guidelines were in effect, and some large zoos shut down entirely for a few months.
Though the above graph does support the hypothesis that big city zoos are suffering from a population decrease, that clearly isn’t the only factor at play. The percentage drop seen in each category is an order of magnitude greater than any population change. Still, we can’t rule out that part of the visitation change was caused by a population shift. That brings me to my second point: Attendance is complicated.
Given that both Big City Zoos and Small City Zoos averaged far below their 2019 totals, it certainly doesn’t support the hypothesis that large-scale demographic trends drive visitation. So, maybe if we look at the absolute number of visitors we can get a better sense of how Big City Zoos and Small City Zoos are rebounding from the pandemic:
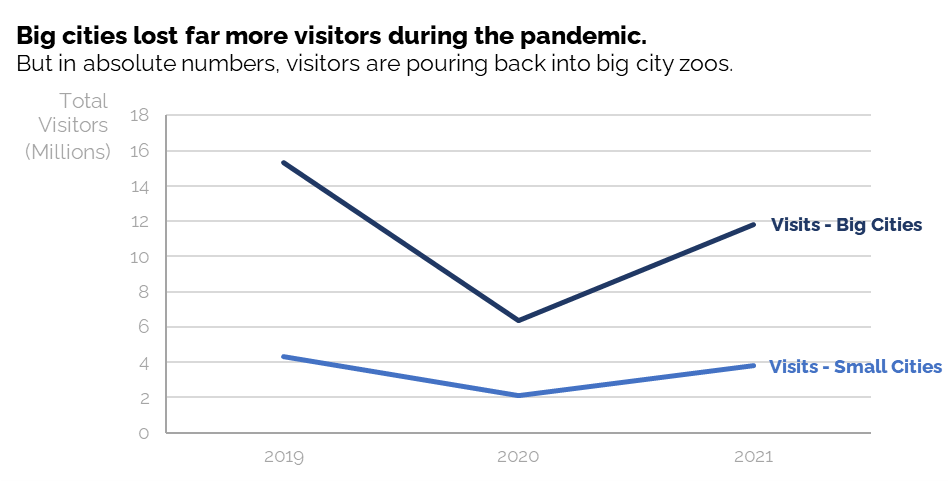
When looking at visitors in absolute numbers, one major trend comes to light – while Big City Zoos lost a huge number of visitors during the pandemic, they’re also gaining visitors back at a much higher rate. In fact, the Big City Zoos that we analyzed had an 86% year-over-year increase in 2021. Small City Zoos had only an 81% year-over-year increase.
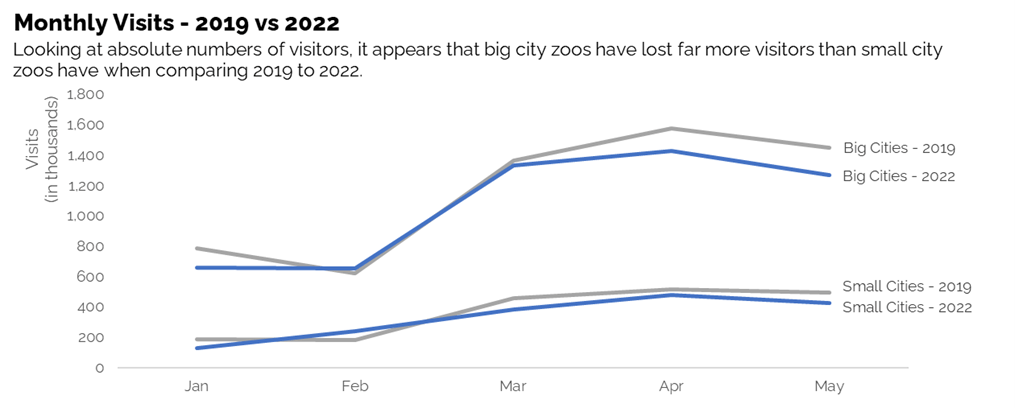
Let’s see how these different zoos are doing in 2022 by looking at their monthly 2022 numbers compared to 2019 numbers:
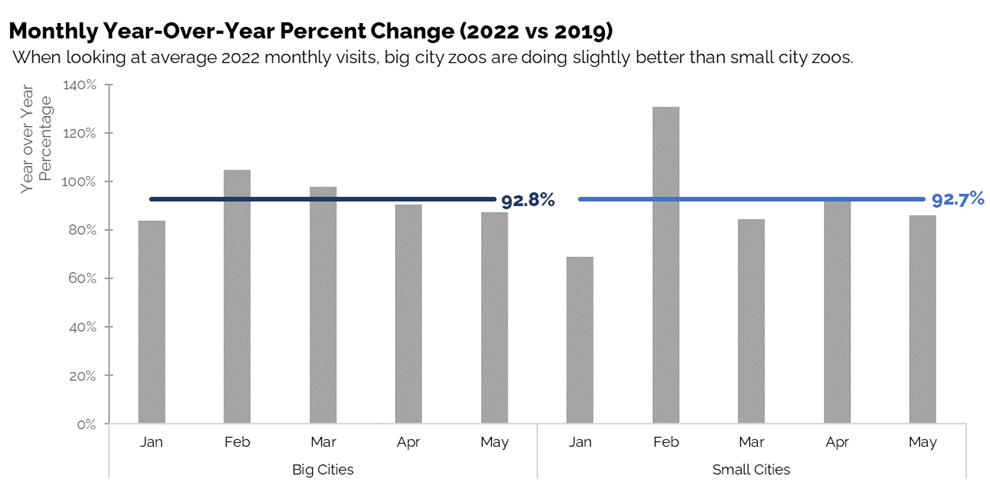
As you can see, Big City Zoos are now surpassing Small City Zoos in the race to get back to 2019 visitation numbers! Due to the rate of rebound seen in Big City Zoos, it would ’t be surprising to see Big City Zoos reach their 2019 numbers several months before Small City Zoos. Larger zoos typically have larger budgets – that can mean more marketing, more community engagement, and could account for the faster rebound.
Now, let’s see how our hypothesis fits into this new data. Big Cities decreased by an average of 1.7% per year from 2020-2021, while small cities increased by 0.3% per year during the same period. However, Big City Zoos are closer to their 2019 numbers than Small City Zoos. While large-scale demographic trends certainly have an effect on visitation, it’s almost impossible to see that effect when looking at large scale trends.
Given how Big City Zoos have rebounded from the pandemic, it wouldn’t be surprising to see that their marketing, membership, and guest services departments can easily handle a small (1.7%) decrease in the local population – for the biggest zoos, this may just mean that they need to increase their marketing budget slightly to attract more tourists. Smaller zoos, on the other hand, may not have the tourist base to draw from and may need to access the growing local population in new and creative ways.
This brings me to my final point: Attendance is complicated.
What can be done?
The problem with worrying about or celebrating large-scale demographic trends is that they’ll rarely apply a large enough affect to your visitation numbers to be of much concern. In fact, here’s a list of many other factors that likely have a much larger effect on visitation:
- Micro-Population Trends – People who visit your organization likely come from a very specific subset of zip codes or neighborhoods. Knowing the population trends of these regions is much more applicable to the growth of your organization.
- New Exhibits / Attractions – Everyone knows that a great new exhibit can bump visitation. New exhibits and attractions can provide a huge temporary boost to visitation. But will the costs of a new project outweigh the benefit?
- Competition – While we would all love for people to love our organizations as much as we do, that’s simply not going to happen. As with all businesses, mission-driven non-profits must compete for the attention and support of consumers.
- Market Trends – In a conservation-focused market, an influx into the local population might mean a large boost to visitation. In a market saturated with attractions, the same population bump might have a minimal impact on visitation to your specific organization.
- Organization-Specific Factors – Let’s face it, everything from the size of your organization to the prices you charge to the expenditures of your marketing department will affect how many visitors you see on a yearly basis. Is your organization optimized?
The Bottom Line
Predicting attendance is really complicated. It’s a multi-faceted, cross-dimensional vortex of convoluted and sometimes conflicting data. We even have data that shows how Gas Prices can drastically affect visitors! The best way to analyze visitation is to look at the factors that are known to be related to how many visitors your organization will attract. The rest is just noise.
If you ever want help analyzing visitation, your audience, or your entire business plan, we’re here to help. All combined, our consultants have decades of experience in the industry and can easily help you break the data down, pinpoint the most influential variables, and make a detailed and comprehensive plan to bring in more visitors, drive up revenue – and above all else – advance you toward the goals dictated by your mission. Click here to contact us.