By: Zach Mellender, Canopy Strategic Partners Content Contributor
As fans of America’s Favorite Pastime headed to ballparks to celebrate Opening Day on March 30th, they were simultaneously excited to see what the new season would bring while engaging in a tradition that provides a sense of stability and continuity. For many zoos that close through the winter, this same sense of celebration and community happens when they open their gates for the season.
But things change. Audiences grow, new opportunities pop up, and even the climate is changing. The same math that 20 years ago projected it was in the zoo’s best interest to close seasonally (or stay open all year) could produce a completely different outcome today. In this article, we’ll look at the differences in visitation between seasonal and year-round zoos. Plus, we’ll take a look at how holiday lights programs affect the distribution of visitors.
Seasonality: What Are We Talking About?
In short, the months you’re open to the public as an organization is a choice – it’s not a given.
Every zoo, no matter the climate, must have year-round staff for essential functions, such as animal care. Some zoos choose to close during seasonal periods (cold, hot, humid, or rainy) that naturally reduce foot traffic. For example, many zoos in the Great Lakes region may close during the winter due to snow and cold.
Let’s take a look at zoos that close during the winter months (“Closed” on the graphs below), versus zoos in the same region that stay open (“Open”). In each of these categories, we examine the impact of months and seasons on attendance. The zoos analyzed here are all in the Midwest region and experience cold winters and moderate to heavy snowfall.
Average Summer Attendance
To begin, let’s evaluate “Summer” attendance as a portion of total attendance. For this purpose, I’ll define summer as all of June, July, and August. The graph below shows the percentage of total yearly visitation that the June-August period accounts for in 10 different organizations – five Closed and five Open.
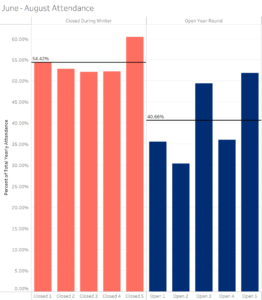
Not surprisingly, a greater percentage of total attendance is seen in the summer for the seasonally open zoos. Interestingly, there’s only a two-point spread for the “closed” zoos, except for number five. We should note that number five has very concentrated attendance in May – August, causing the outlier.
There’s far more variety in the year-round zoos. Two of the zoos open in winter are actually very close to the closed zoos in percentage of total attendance with only .25 – 3 points difference! It’s noteworthy that these are the only two year-round zoos in this data set to not exhibit a “holiday lights” experience. These two zoos also have overall lower attendance than the other three open zoos. We’ll take a closer look at holiday lights towards the end of this article.
What does this mean as a whole? While summer is certainly a large portion of the season for all of these zoos, two zoos see only a third of their attendance in the summer – and they have a similar climate! It certainly reinforces the idea that being open is a choice – one that must be made by each institution based on how they think their audience will support them in the wintertime.
January – March Attendance
Given the previous note regarding holiday lights, let’s evaluate January – March visitation. For the five zoos open, the average total portion of attendance is 9.27%. That’s a noticeable number! Note again that the two zoos that do not offer holiday lights have lower numbers than those that do. If we exclude those two, we find an average of 12.5%. (Remember – the closed zoos are all at 0%).
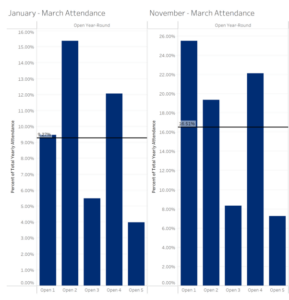
If we add November and December, we see that 16.5% of all attendance is during months that neighboring institutions are closed. For zoo one, that number is a quarter of their total attendance!
Note that in this article, I’m not evaluating any expenses that would come with operating year-round. However, the zoos that are open seem to have a materially significant impact from winter operations. Within your own institution, how do you calculate the cost of operating with essential staff only and with operational staff, in whatever limited capacity? Perhaps we could establish a formula with these parameters:
- O – Overhead Cost
- Costs required to maintain the zoo, irrespective of guest status. E.g., animal care, feeding costs, full-time staff labor, etc.
- G – Guest/open gates cost
- Additional costs required to admit and provide amenities to guests. E.g., guest service staff, increased facility usage, consumables such as food, etc.
- R – Gross Earned Revenue
- Revenue gained by being open.
R – (O + G) = Net Revenue
Assuming this is roughly true, the year-round zoos would use this same formula each month. It can and will vary, as we see from attendance percentages. However, the formula holds true throughout the year. For seasonal zoos, R and G are replaced by 0 (zero). This does not represent a net loss on the annual budget, but certainly does on those operating months. For the zoos that are open, it seems that attendance justifies the additional cost of G.
So, what it all comes down to is estimating the revenue that could be generated (“R”) and modeling if it counterbalances the weight of being open to the public. If Net Revenue is positive, it’s good for the zoo’s mission to stay open simply to keep generating money. If Net Revenue is negative, a decision has to be made – will staying open through the winter advance the mission enough that it’s worth losing money on?
Holiday Lights
As we saw above, there seems to be a material relationship between December attendance and holiday lights programs. It would be quite grinchy of me to ignore that point, so let’s take a look at the impact.
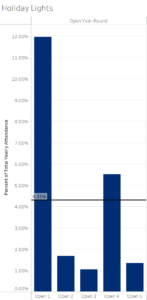
For the three institutions offering holiday lights (one, two, and four), the average attendance percentage is 6.39%. Considering 8.33% would represent each month in a year with perfect visitor distribution, 6.39% is not quite a “full” month. However, considering these visitors could not come if the zoo was closed, this seems like a significant portion of visitation. For institution one, this is actually the second highest attended month, after August. The other two institutions reveal a less significant impact from holiday lights, despite seeing higher winter numbers than the two zoos that don’t offer holiday lights. This is a key comment – keeping your zoo open year-round doesn’t necessarily require holiday lights.
Should We Be Open?
While this analysis is intriguing, we’re left without an absolute answer. We could say that all zoos should be open year-round, but we shudder at such a blanket statement. Our recommendation and takeaway comment are that each facility must do careful analysis. There’s clearly evidence to suggest winter operation is one possible method of bringing in some revenue, especially to offset costs that are unavoidable (such as essential staff and food items). However, this evidence doesn’t dig into per capita values or actual operating costs. It’s also not exhaustive in analyzing holiday lights. There are other components to include in this analysis, each unique to every zoo.
Our final piece of advice is to examine your institution and your opportunities. Define metrics and benchmarks to measure success. Read over this information and begin your own, detailed analysis. We’re always available to assist.