In case you missed our last post (check it out here), this is Part 2 in a series of blogs we’re putting together to summarize the findings of a recent research study we completed.
The goal of the study was to gather and consolidate data from a group of partner organizations in AZA (Friends groups, Foundations, Societies, etc.) in order to extract meaningful information about how they operate, and to quantify their operations in aggregate. Fourteen different organizations participated and submitted historical data, amounting to 70 discreet years of financials and other operating metrics to unpack.
In this post, we’re sharing a big chunk of our findings. In the graphic below, you’ll see a range of metrics that quantify what the group averages (or in some cases, medians) looked like.
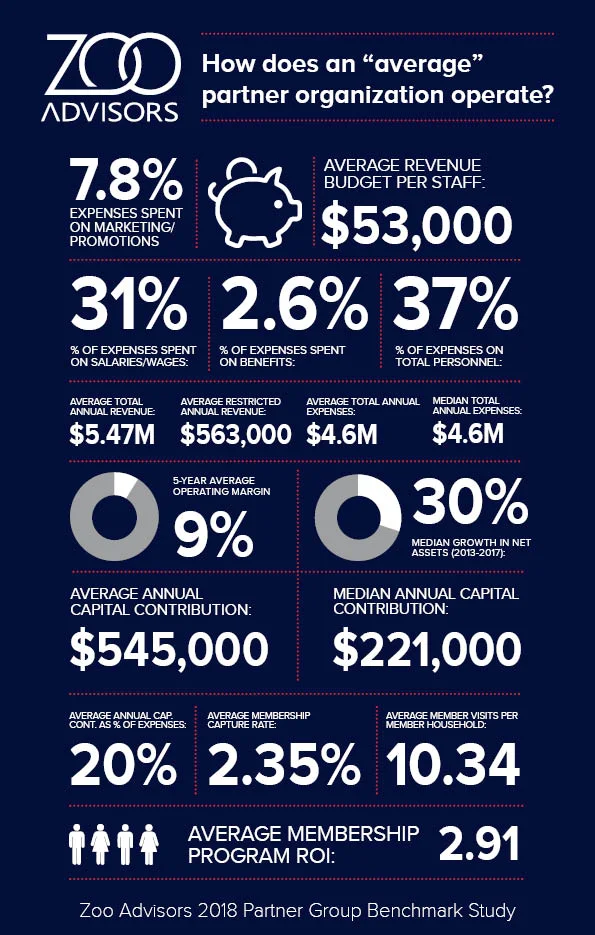
How does your organization compare? Is your membership program generating a good ROI? Are you spending enough on marketing? Are your personnel costs out of control? This is valuable information that you can use to compare/contrast the operating success and challenges of your own organization.
This is only part of the picture and if you’d like to learn more about the study, or talk about how Zoo Advisors can help you achieve your goals, drop us a line here and we’ll get back to you soon!