Take a moment to imagine you’re a farmer, planting crops year after year. Every year, the result looks different: you may encounter good weather, bad weather, natural disasters, machinery breakdowns, pest infestations, etc. The success of your crop and your profitability are based on a variety of factors — some predictable, some not.
For cultural organizations, your audience is like the farmer’s ‘crop.’ If you have endless sunny weekends and cool, well-marketed exhibits, you will likely have great attendance and a profitable year. But what if it rains constantly, you hit an unexpected exhibit construction snag, or a pandemic shuts everything down? How are you supposed to make informed decisions for organizational planning?
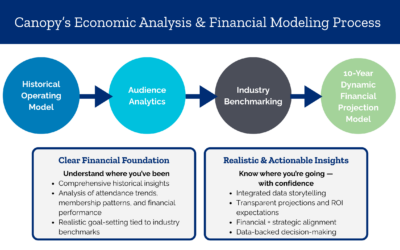
This is where Canopy’s unique dynamic projection modeling process comes in. Our comprehensive analysis helps organizations use their existing data to project 100s of 1000s of future scenarios, combining present knowledge with key assumptions and strategic insights. In a nutshell, dynamic projection modeling helps our clients:
- Understand the best-case and worst-case scenarios, and every scenario in between, to assess realistic upside/downside risk potential.
- Bake in growth expectations and unexpected penalties, accounting for elements like weather, construction, and ‘Force Majeure’ events.
- Critically examine whether future projects are worth the financial risk.
- Put their data to work, combining known factors with Canopy’s expertise to have a clear picture of what’s possible and which recommendations to follow moving forward.
Curious how the process works? (We can’t be the only data nerds out here…) Read on for a deep dive:
What is Dynamic Projection Modeling?
Dynamic projection modeling is a Canopy signature service that we implement with all our business and master planning clients.
While other consulting firms can examine your data and assess your upside potential and downside risk, our experts take that process several steps further, delivering a more realistic model to our clients. Typical business planning includes forming a single set of assumptions (audience size and engagement, weather, impacts of construction projects, and ‘Force Majeure’ events — like the pandemic). These assumptions on how big your audience will be drive the remaining math in your business plan. If your assumptions are wrong, the whole plan is wrong. What seemed profitable can quickly turn expensive, leading to a cascade of cash flow issues as you work to establish new assumptions.
When you’re working with Canopy, we don’t just give you one set of assumptions; we generate hundreds of thousands of different sets of assumptions and see how the math plays out across them. From unimaginably wonderful scenarios to terribly catastrophic predictions — and everything in between — we combine your data with our expertise to create a comprehensive business projection model, providing you with a view of 100,000+ scenarios on a sliding scale.
How does it work?
Using your organizational data and our Audience Analytics platform, we pull in different operating metrics: big program additions and capital expenses, background population, attendance composition, membership transactions, admission prices, etc. Then we look at your finances: a full breakdown of revenue and expenses.
Our clients give us this data for the ‘runway years’ — all the years up until their current budget years. The historical model we create is a complex spreadsheet that connects your attendance, membership, programming, revenues, and expenses into a large-scale math problem. We then layer future projects onto this math problem, such as exhibit plans, major capital projects, or changes in the membership program. This is the foundation of Canopy’s unique Projection Model.
Now, here’s the cool part…
To make this model dynamic, we must take our base assumptions — program changes, capital projects, and other things we plan to try — and see what would happen to these projects under hundreds of thousands of different scenarios. Plugging your current attendance into our simulator, we generate a plethora of penalties or growth expectations from your plan that may apply to each future year. When we run the simulation once, it applies some of these penalties (i.e., heavy construction, -10%) and some of the growth expectations (i.e., decent weather, +5%) to each year, building the scenario with estimated attendance totals for each year. This 10-year attendance estimate is one scenario; we then run the simulator 99,999 more times, creating over 1,000,000 estimates of yearly attendance that are all slightly different based on the portion of penalties and growth expectations randomized in each simulation.
With these attendance scenarios driving the final Projection Model, you can see both the full upside of a perfect series of years and the full downside of a downright miserable decade. However, we recommend focusing on the 50th percentile: this is what we think is most likely to happen, given our decades of industry experience watching these types of projects unfold.
What is the result for our clients?
Canopy wraps all this information up into an interactive model, with the vast range of potential scenarios encapsulated in a slider that each client can use to see different performance percentile outcomes. With pricing, membership, attendance, and other aspects of your operation built into the model, it’s easy to experiment with different pricing and program tactics to see how it will affect your bottom line: both currently, and in an imagined future that is the greatest, average, or worst-case scenario for your organization.
For example, if:
- At the 0th percentile, in the absolute worst-case scenario, the organization will lose 2 million. Okay, that’s manageable.
- At the 25th percentile, the organization will net $100,000. Not bad! A small profit for a not-so-great scenario.
- At the 100th percentile, in the absolute best-case scenario, the organization will net 20 million. Wow; this project has way more upside potential than downside.
That data tells the client that their project plan is probably worth the risk. (And they can still look at every other percentile in between!)
At the end of the day, our goal at Canopy is to help our clients make the most educated decisions possible. Ultimately, a model is a tool — a very useful one, but only maximized in the right hands — and it’s only one part of our business planning methodology. The other part of the equation is the breadth of expertise and experience we bring to the table. We’ve been engaged hundreds of times by cultural attractions large and small, ranging from zoos to aquariums to botanic gardens to science museums, which means we’ve seen a lot! Odds are, we’ve worked with an organization that looks a lot like yours, and we can bring the benefit of that experience to bear for your team. We understand not just what works, but what works best for you.
Interested in how this process can work for your organization? Learn more about our planning services.